
A Nationwide Gerrymandering Thought Experiment
What if we could gerrymander not only within states but gerrymander the states themselves? The answer isn't pretty.
I kept thinking about this particular “What if?” question.
What if the U.S. adjusted its state boundaries every decade (like we do most Congressional districts) to achieve equal population?
And what if people with partisan agendas got to draw the maps?
(This scenario might not seem so far-fetched if you look back at the fierce debates about how to reconcile representation for variously populated states prior to the Great Compromise of 1787.)
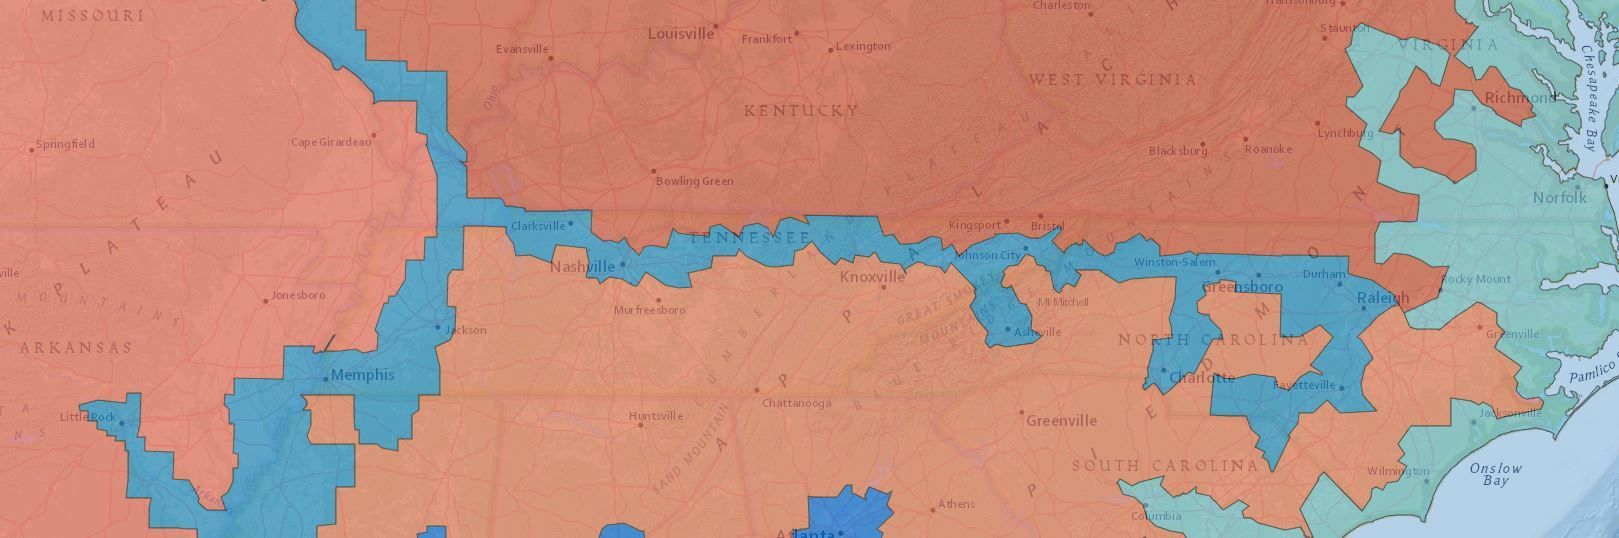
As a nod to the original 13 states—and to my Tar Heel State’s notoriously gerrymandered 13 Congressional districts—I set out to doctor 13 state boundaries to see how severely I could skew representation for our roughly 50:50 electorate.
Could I achieve a 10:3 outcome, as the mapmakers did in purple North Carolina? I could, and not just in favor of the GOP.
Here’s what a national gerrymander by Republicans might look like.
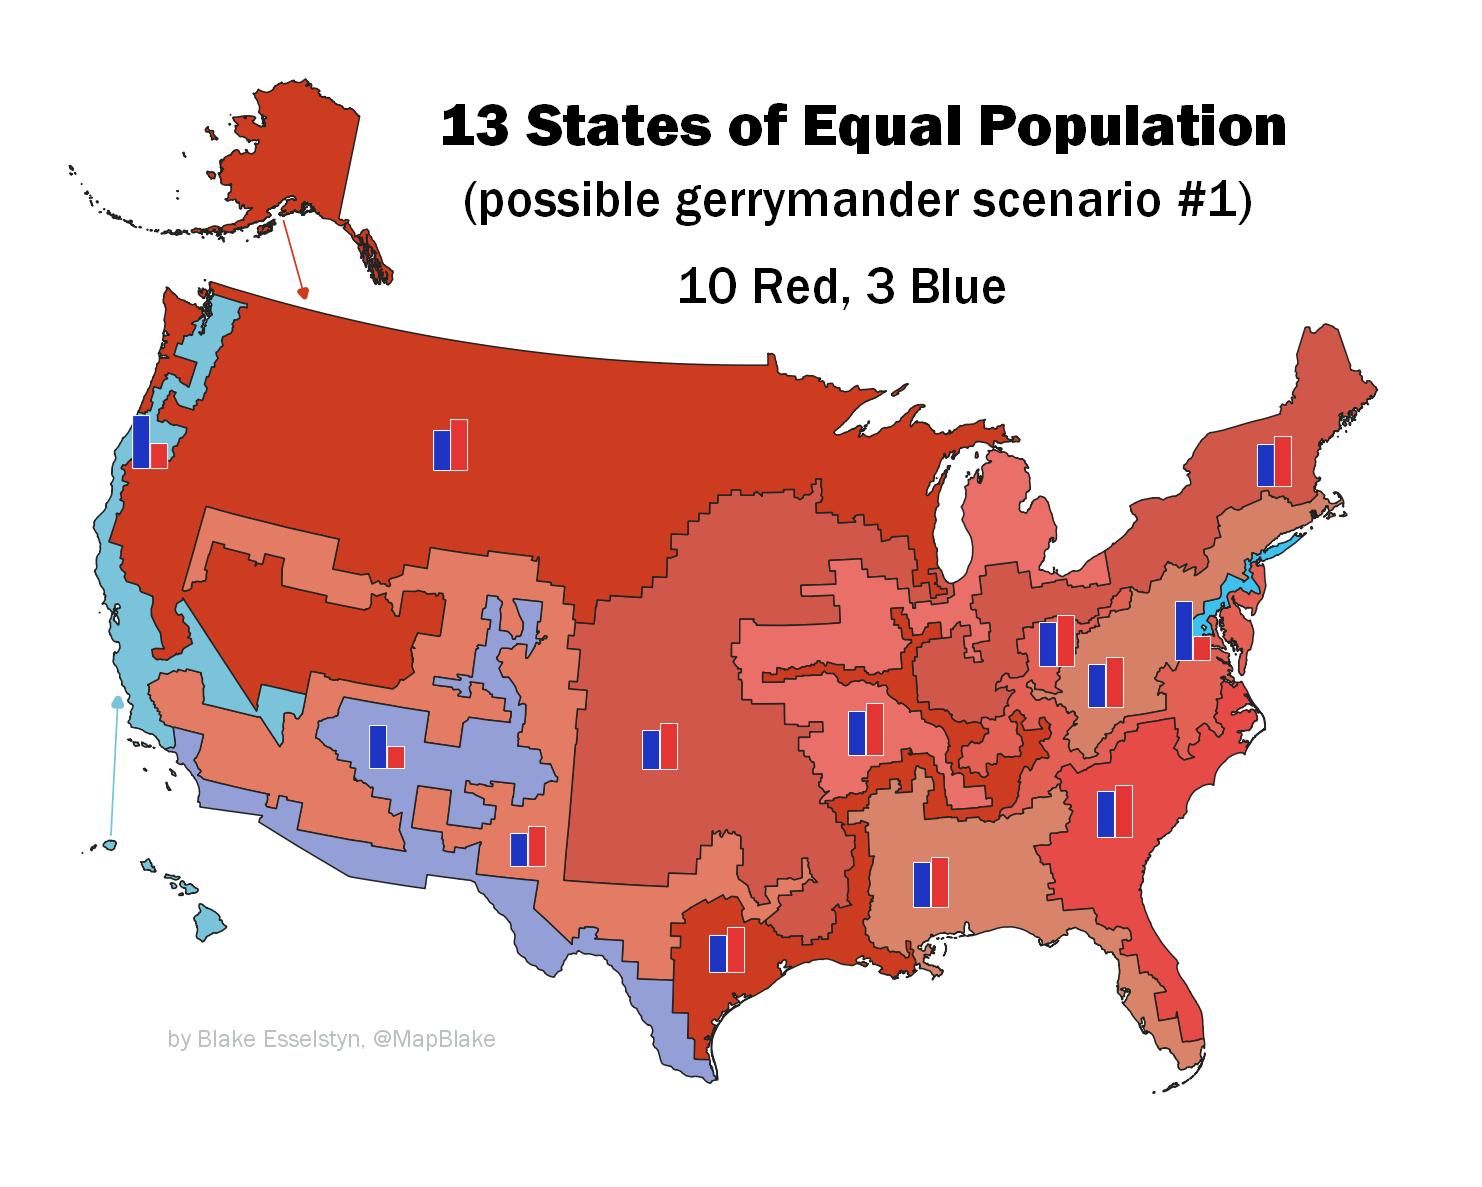
You can see that my key technique was time-honored packing and cracking. Areas strongly favoring Democrats get concentrated into as few hugely lopsided districts as possible (three), namely the Washington DC to New York City megalopolis, communities near the Mexican border stretching from Texas to LA (with a tendril reaching up to grasp urban areas in Arizona, New Mexico, and Colorado), and most of the West Coast with Las Vegas and Hawaii appended. Other blue-leaning areas are divided up and paired with very red areas to yield states with narrow—but safe—Republican majorities. See, for example, how the normally blue-ish Florida peninsula is divided into two states, adding areas from the Deep South to make each vote red.
And we can also achieve an equivalent result for Democrats.
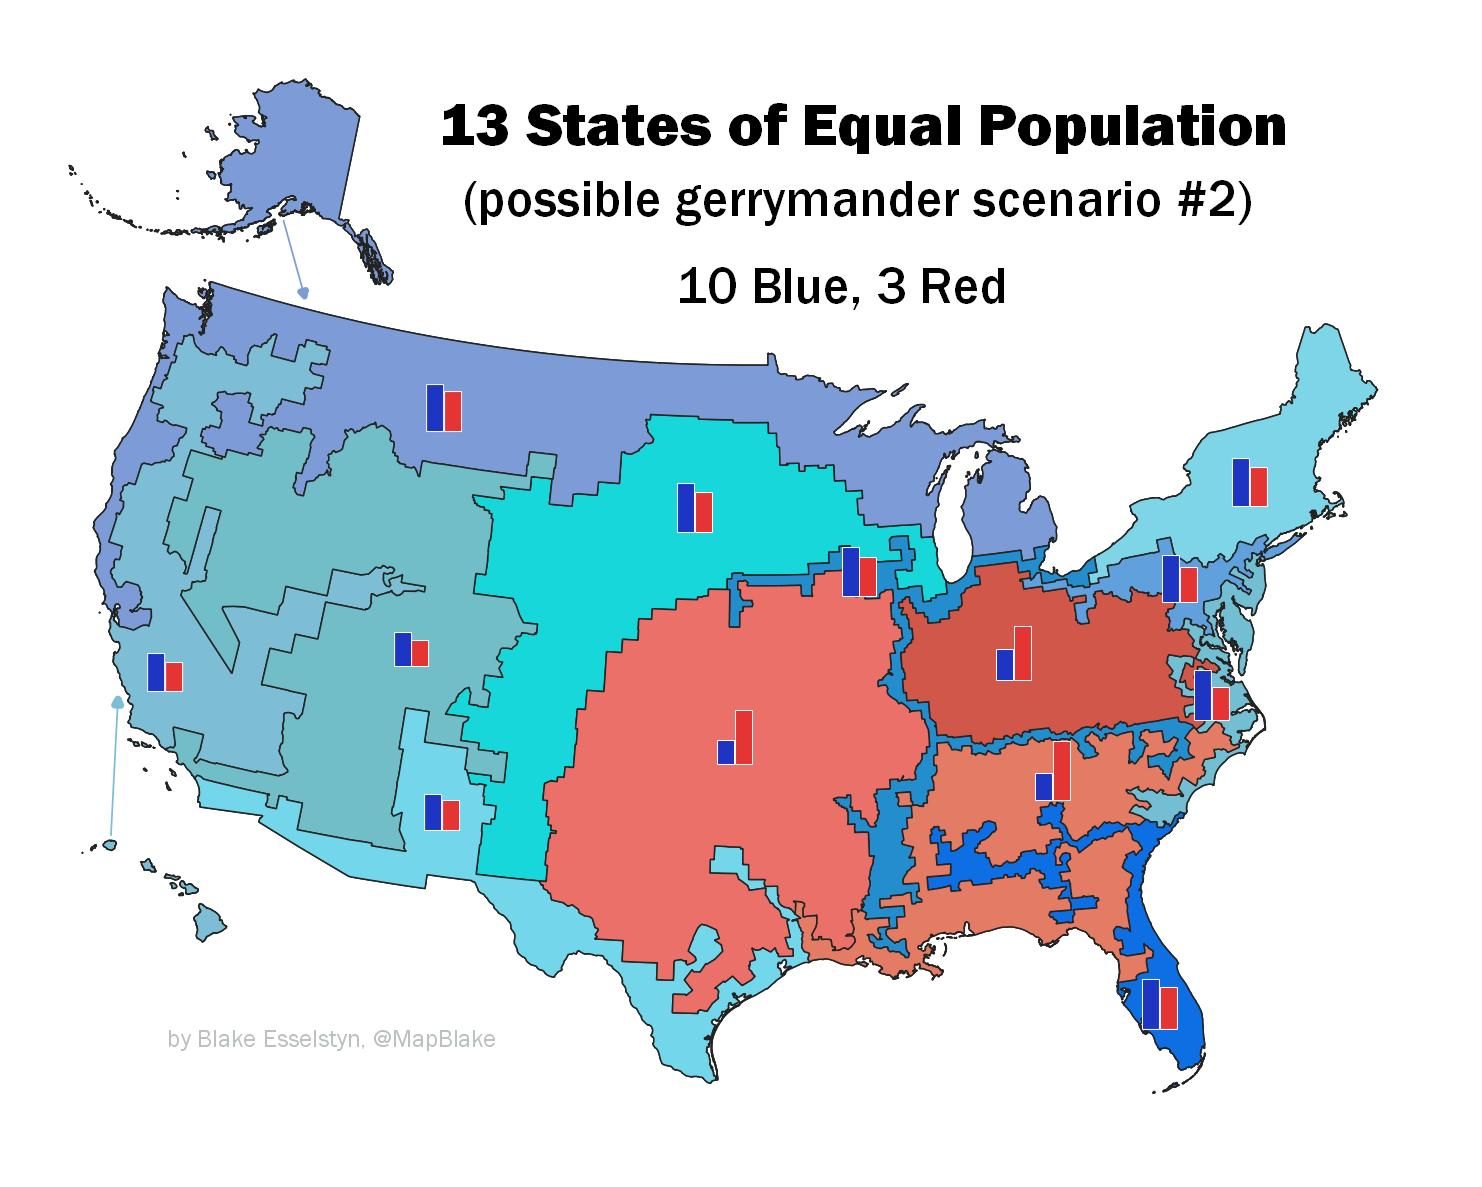
Again, the party not drawing the map gets three landslide districts (the northern industrial Midwest plus northern Appalachia, the eastern mostly white Bible Belt areas combined with the Gulf Coast, and much of the the southern Great Plains with rural Texas). The remaining districts often need to be stretched to include just enough urban area to tip the scales in favor of Democrats: see the Grand Rapids & San Francisco district, the Chicago & Albequerque district, or my favorite, the stringy Baton Rouge-Raleigh-Saint Louis-Lincoln-Cleveland district!
Some day, I hope to do a more thorough write-up (maybe even a story map) with more discussion of the methodology, the lessons learned, and calling out some of the quirky boundary details I had to include to make it work. But I'd been sitting on this map for months, and felt it might be useful for folks to see gerrymandering on a larger map whose geography and political leanings are perhaps more well-understood than those on a less-familiar state map.
I do want to point out that I don't think I could have done this exercise without the Maptitude for Redistricting software. The folks at Caliper had generously made a few licenses available for the Duke and Common Cause NC simulation of an independent redistricting commission (which I worked on). Given this challenge of working with a complex, customized, nationwide dataset, that program, with its range of tools and configurations, made me confident that it was doable.
Here's an interactive version of the Red-skewed map, and an interactive Blue-skewed map if you'd like to explore them more closely.
Comments or questions? Please drop me a line.